
Everything your organisation tracks in Pyron connects end to end. Your sites, teams and assets sit in a tree; the forms and checks people fill in become entries against that tree; dashboards read those entries live; and automations act on them on their own. Once you see how these four pieces fit together, the rest of Pyron follows.
Your workspace is a tree
Pyron organises your whole operation as a tree — a branching structure of the places, teams and things you keep track of. The top of a branch is your organisation; beneath it sit your sites, and beneath each site the areas, rooms, vehicles or equipment that belong to it. A branch can hold as many levels as you need, so the tree mirrors how your organisation is laid out.
Each item in the tree can be a site such as Harbour Point or Hillcrest Centre, a register such as Vehicles or IT Hardware, or any grouping in between. You move around this structure from the Directory section, which offers three ways to look at the same tree — Tree, Sunburst and List — so you can switch between a branching diagram, a circular overview and a plain list without losing your place.
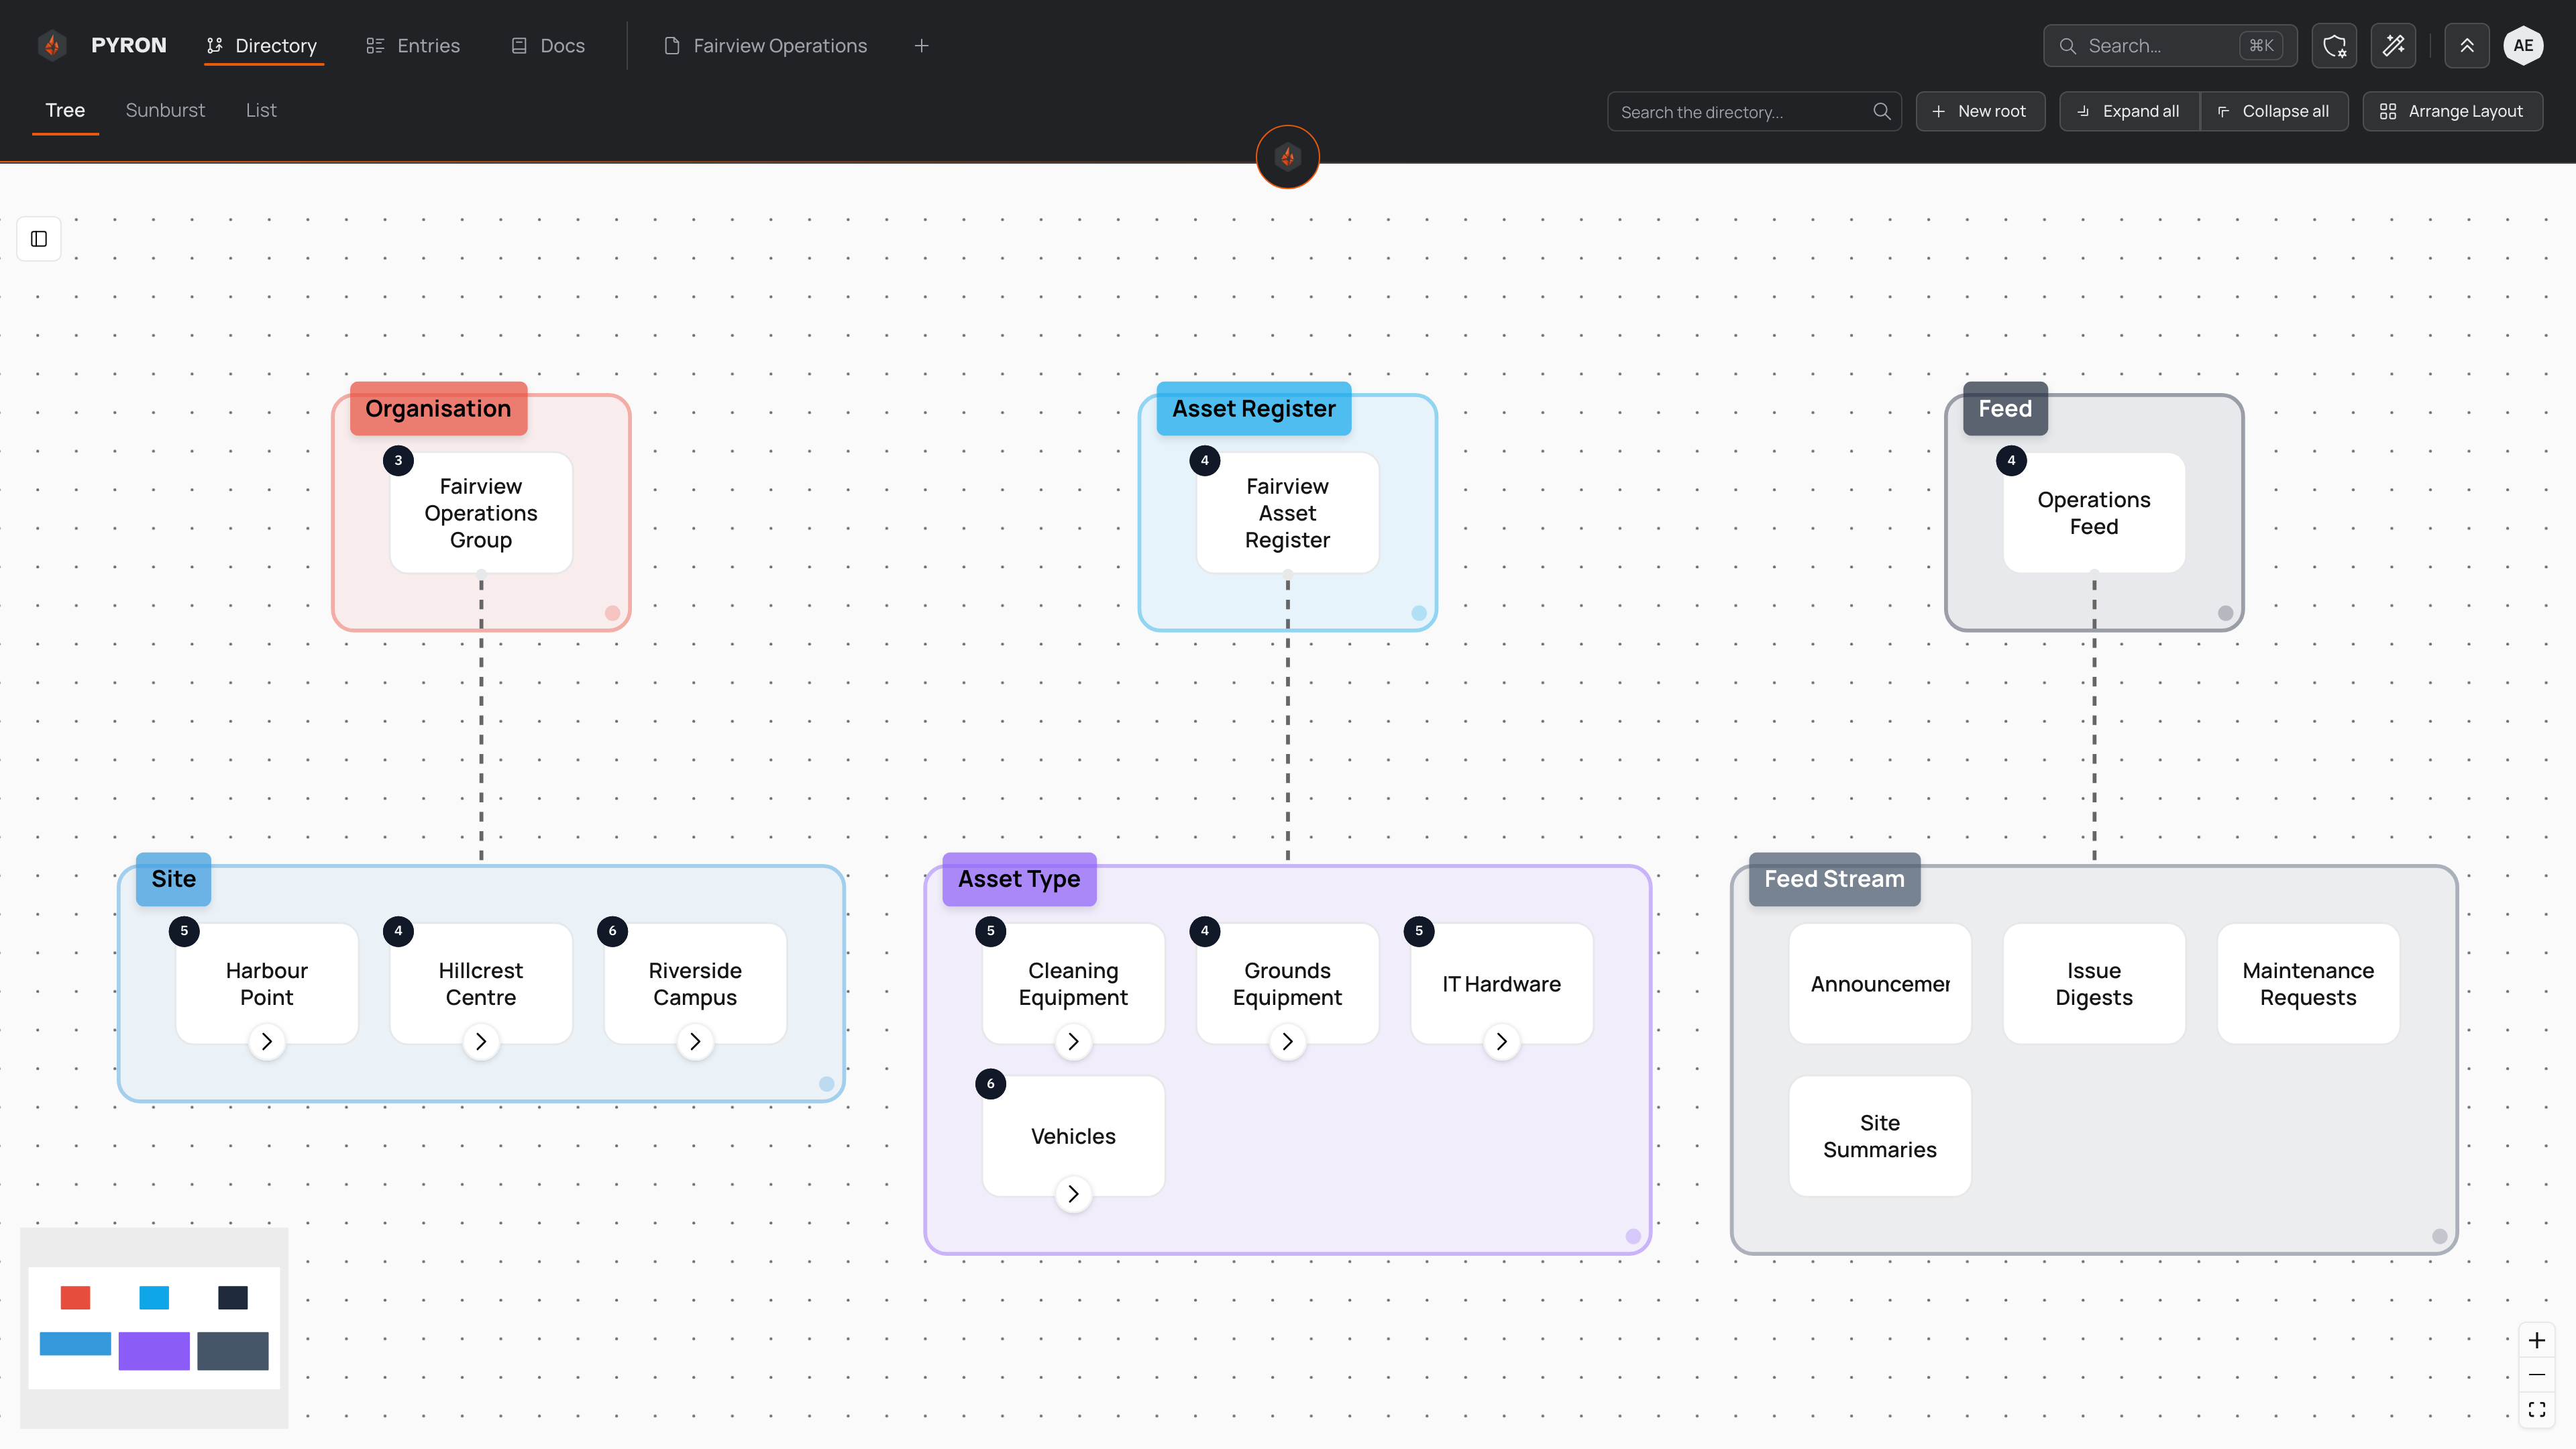
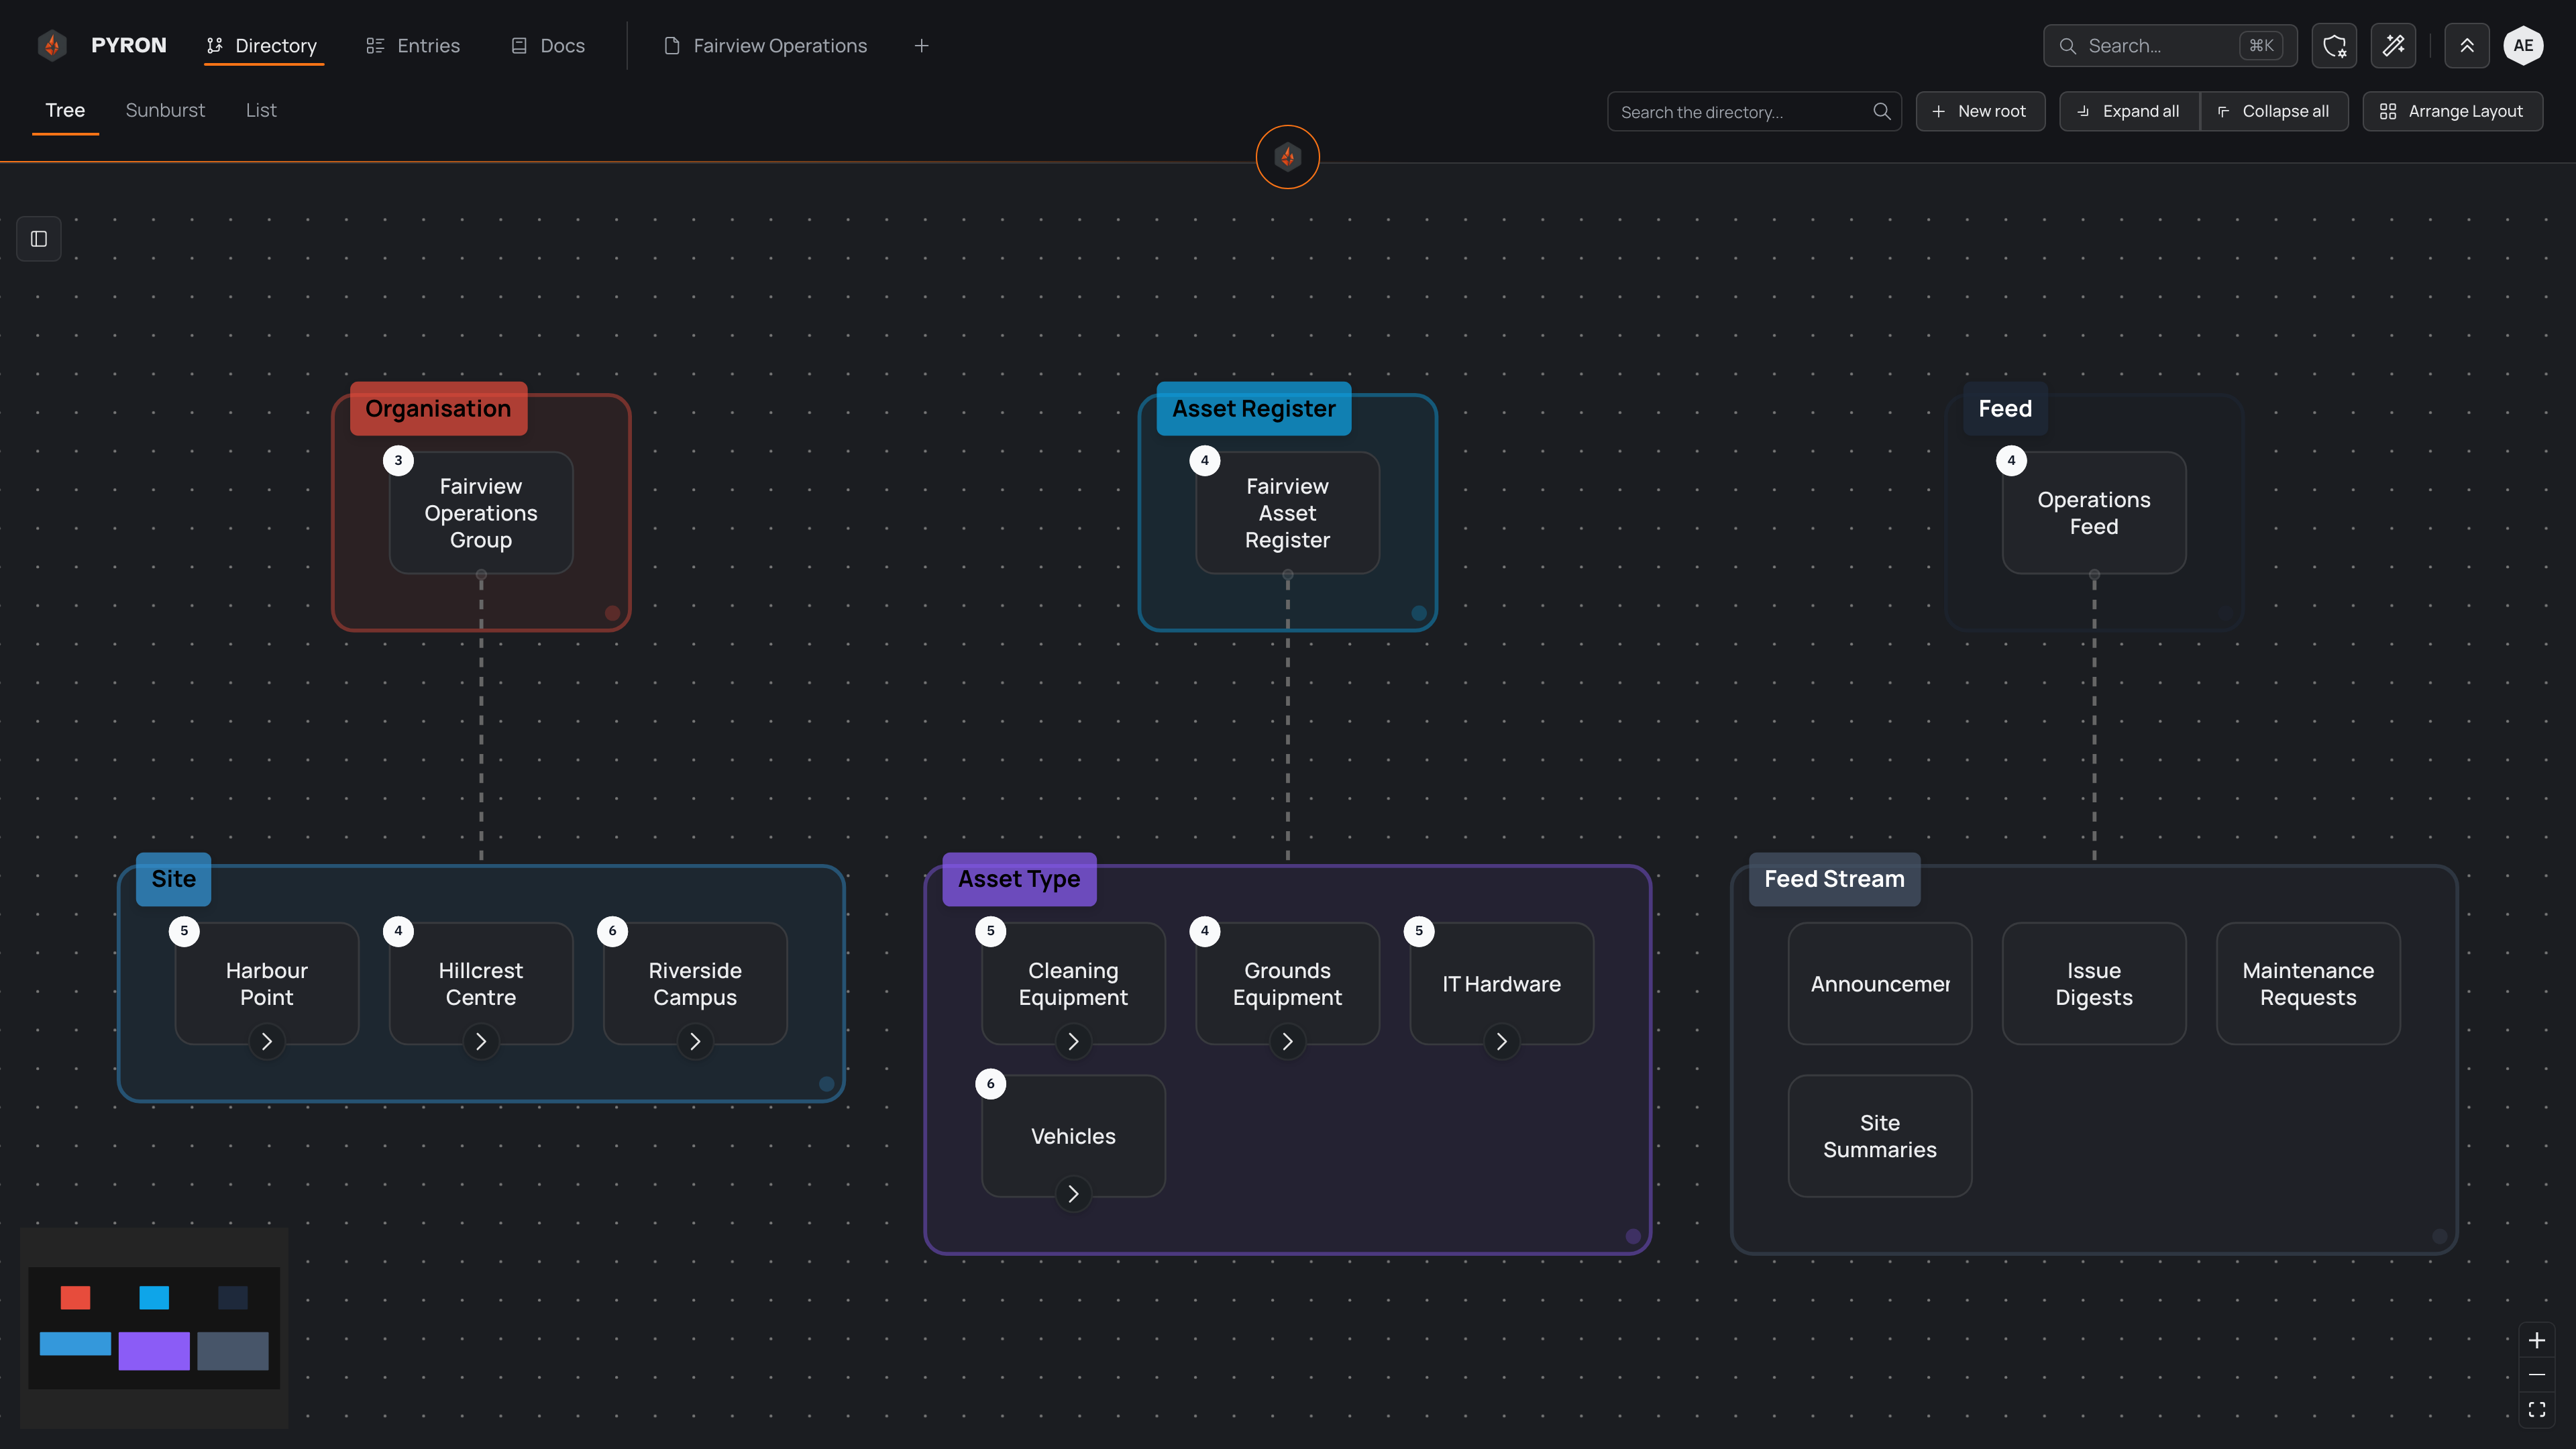
Where something sits in the directory also decides who can reach it and what belongs to it: access and information both follow the branches. For the full idea, see The directory.
Entries are your records
An entry is a single thing someone has logged in Pyron — an inspection, a shift check, an incident, a completed job. Whenever a person fills in a form somewhere in the directory, that submission is saved as an entry, filed under the place it belongs to. Entries are where the detail of your operation lives: the directory gives you the structure, and the entries fill it with what happened.
The Entries section gathers them in one stream, grouped by where each was filed and newest first. Selecting an entry opens it alongside the list, so you can read its full detail without leaving the page.
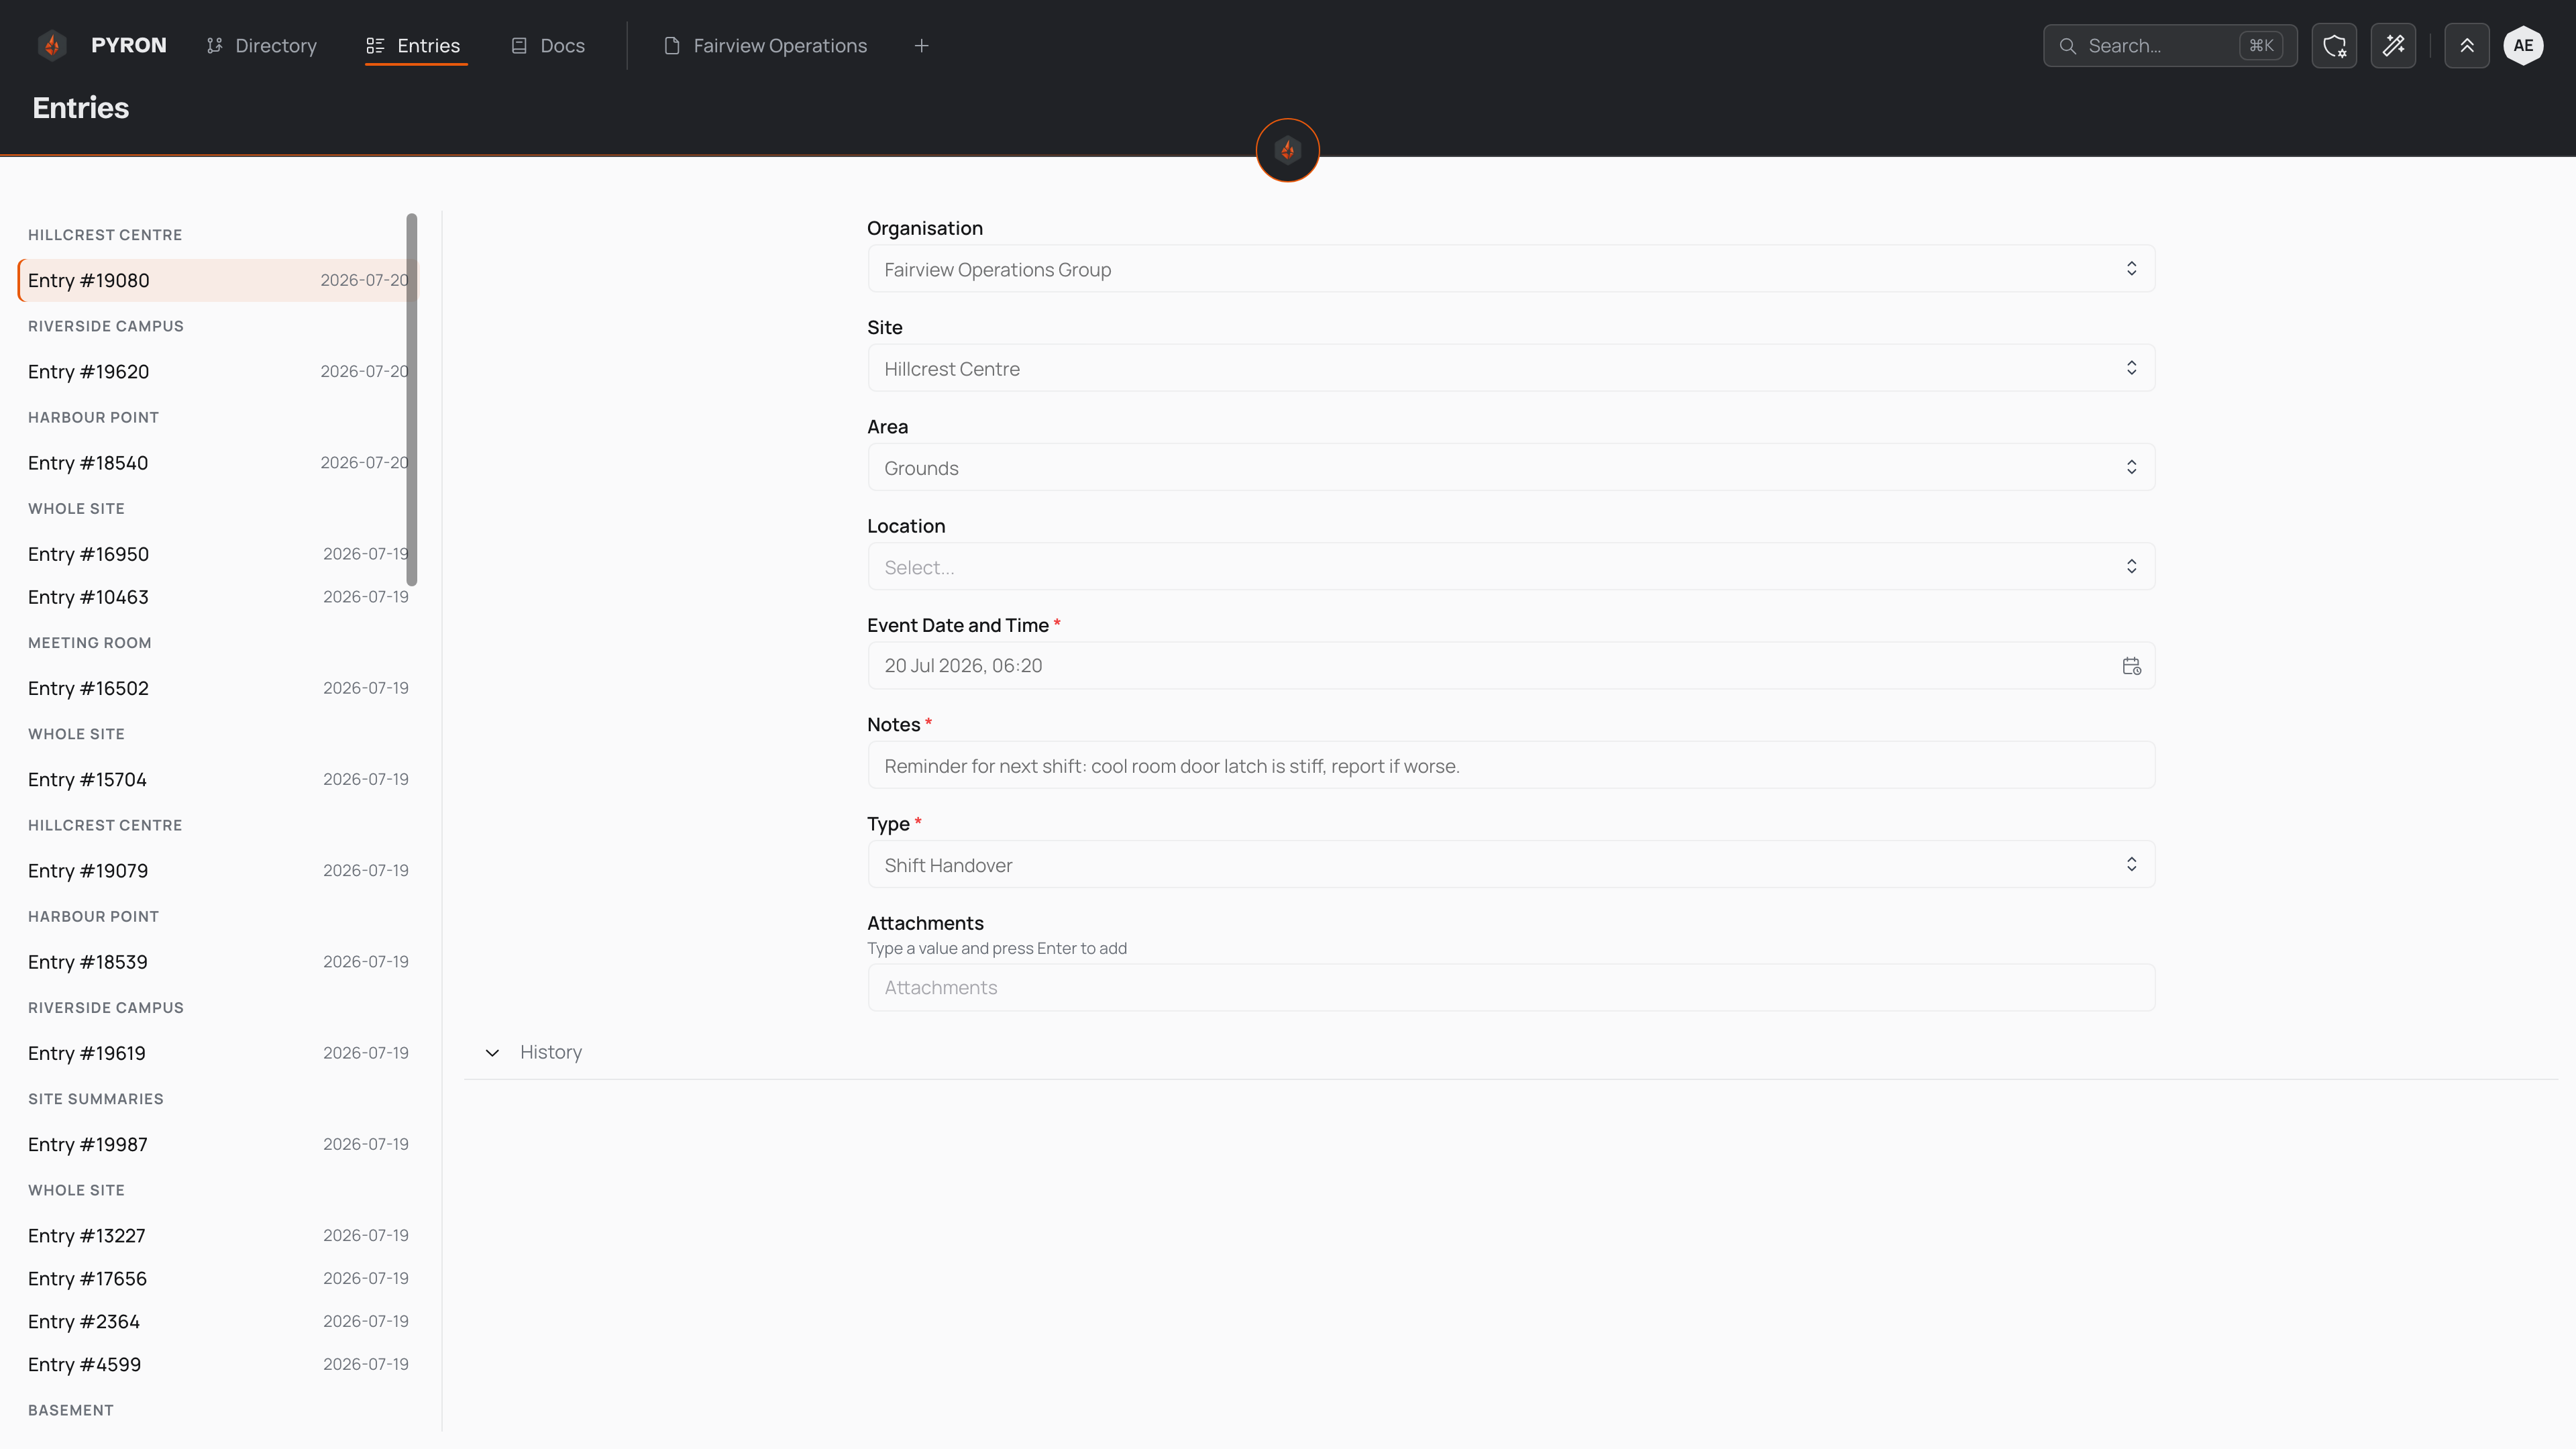
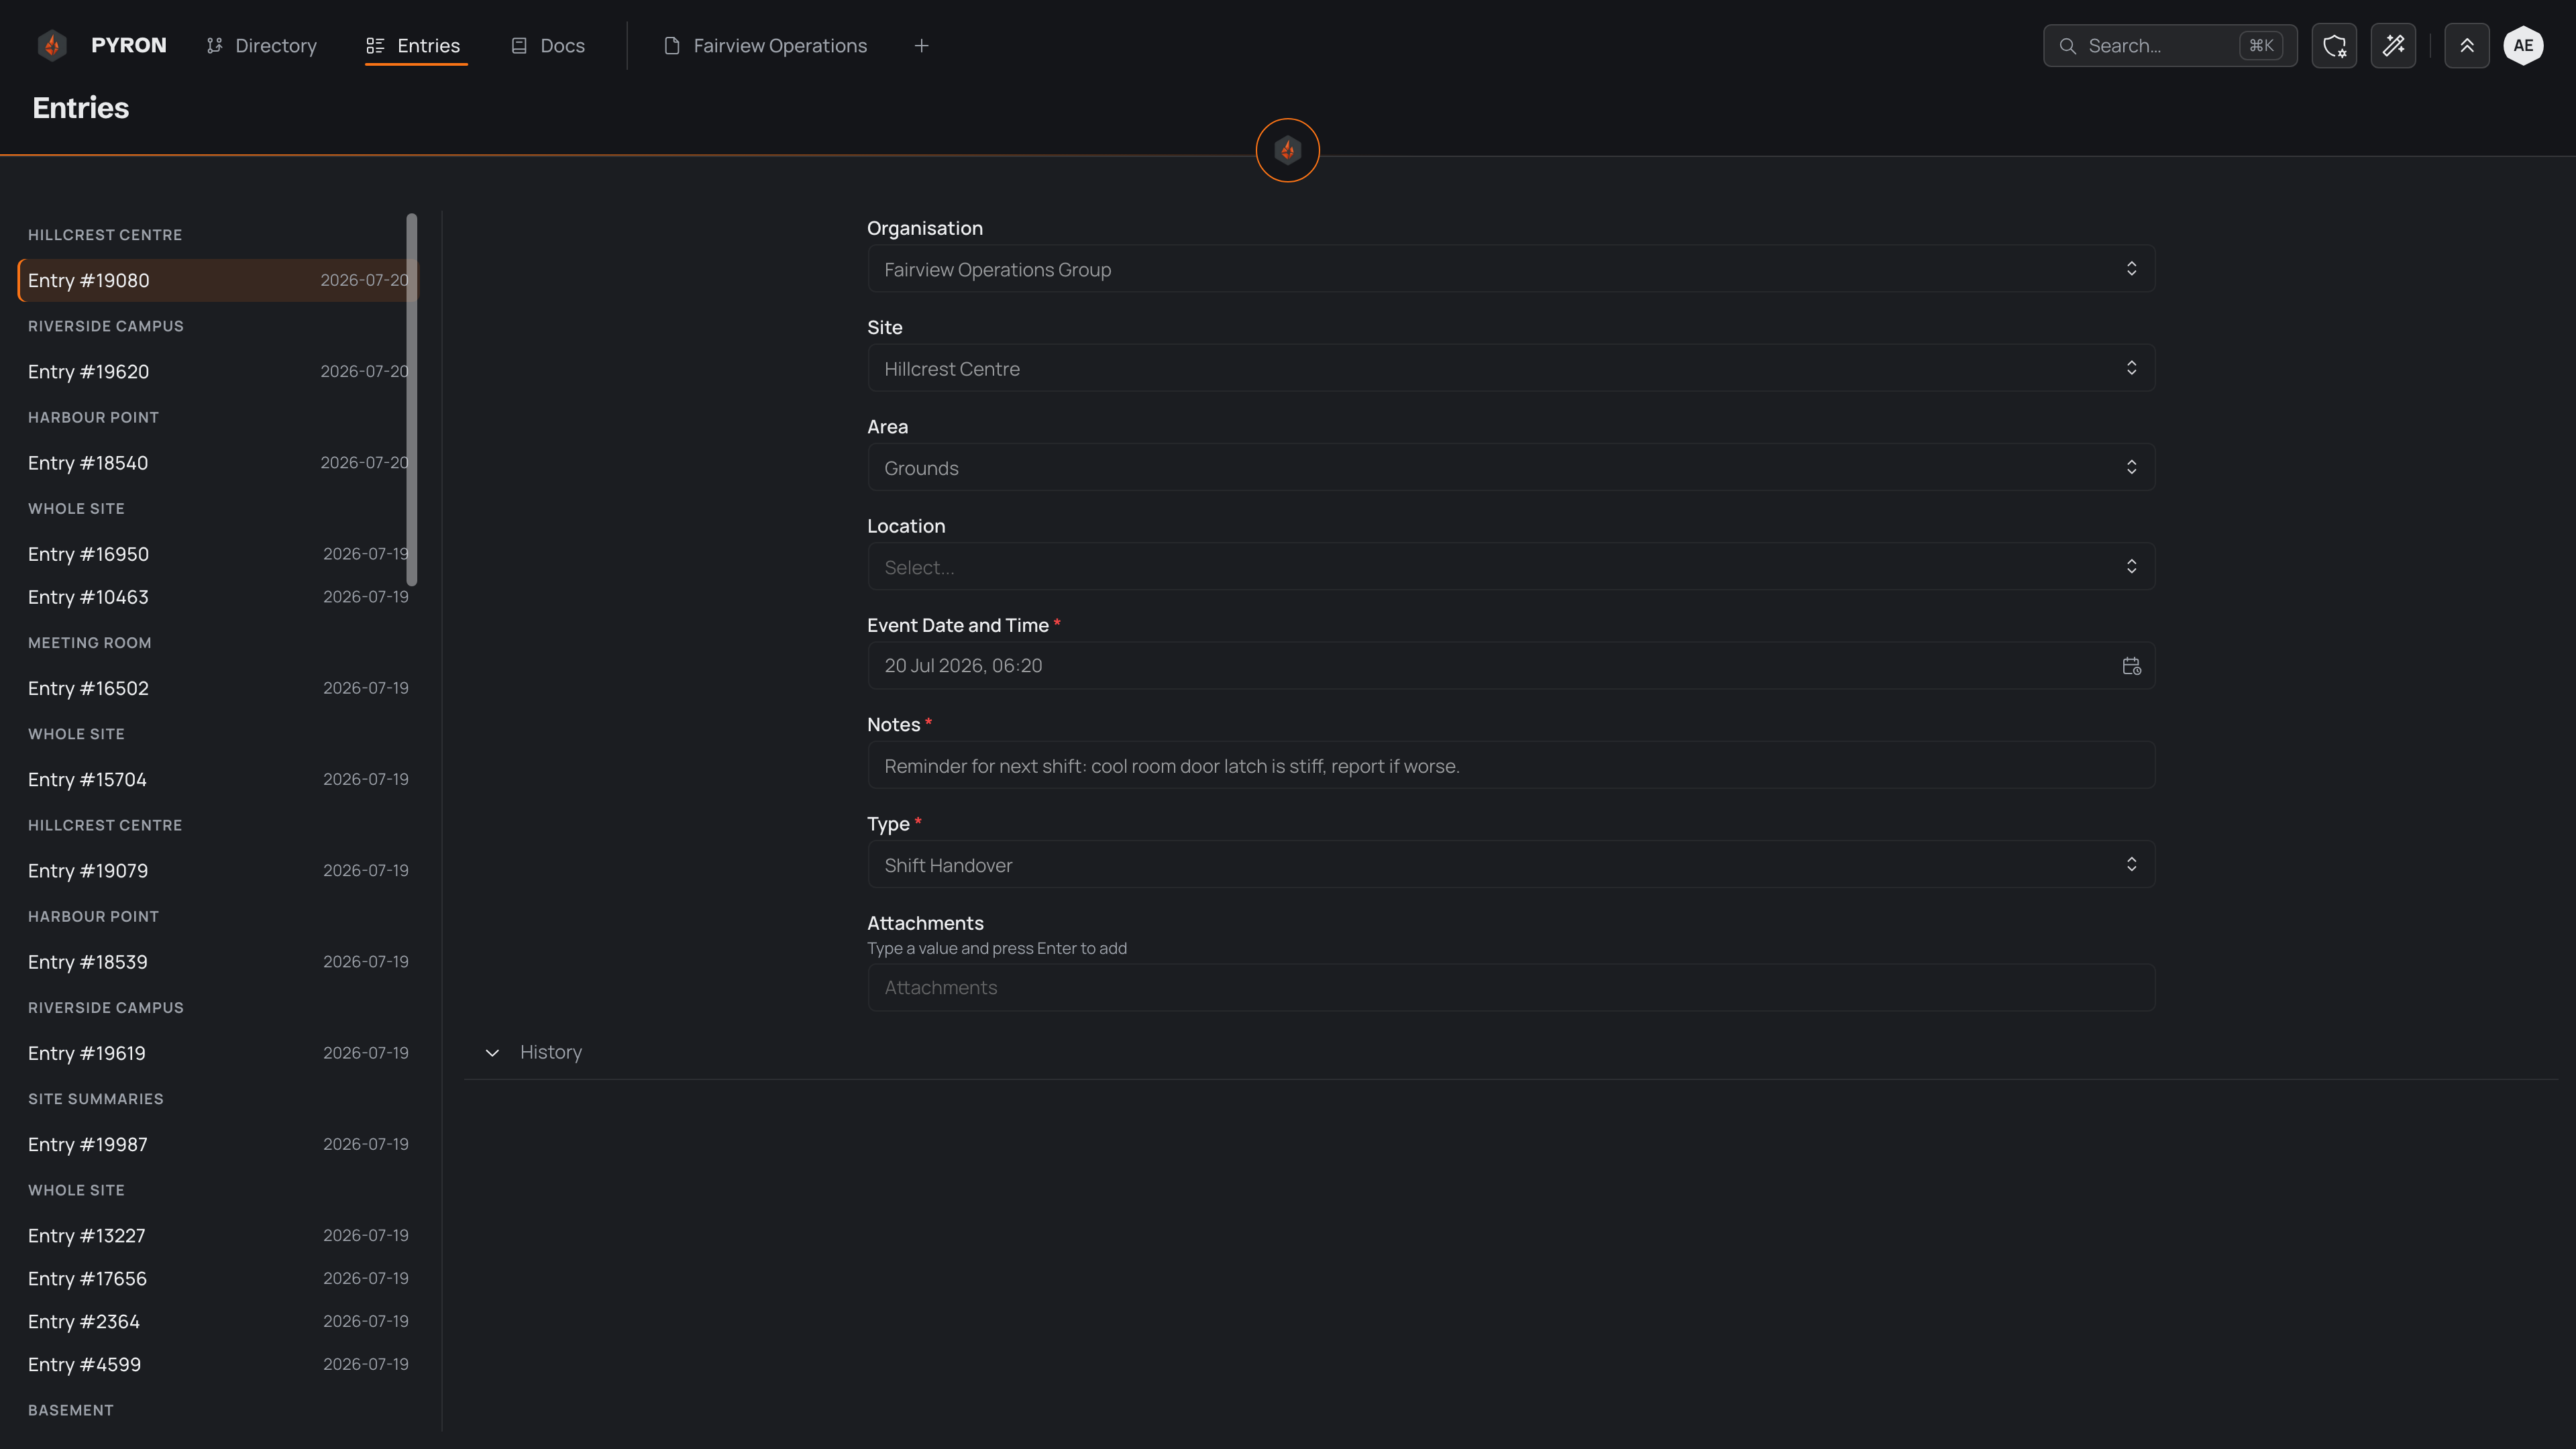
Because every entry is filed somewhere in the directory, you can also see just the entries for one part of it by opening that place's page. To understand entries in depth, see Entries; to work with them day to day, see viewing entries and creating an entry.
Dashboards read your entries
Once entries are flowing in, dashboards turn them into a picture you can read at a glance. A dashboard is a screen built from small panels — a single headline number, a chart, or a table of entries — each one measuring some slice of your information.
Every panel reads straight from your entries. When someone logs an inspection or closes a job, the entries behind a panel change and its figure recalculates to match, so a dashboard shows where things stand rather than a total saved earlier. You never refresh a number by hand.
The same building blocks appear throughout Pyron: an individual site or asset can carry its own page of panels, and you can keep a personal dashboard of the figures you check most. Dashboards respect access too — a panel only counts the entries you are allowed to see. For more, see Dashboards and Pages, tabs and widgets.
Automations and reports work while you sleep
The last piece keeps Pyron working when no one is watching. An automation is a set of steps Pyron carries out for you the moment something happens or at a set time — email a manager when a high-priority entry is logged, or gather the week's figures every Monday morning. You set one up once, and it runs on its own from then on.
Reports work the same way on a schedule: Pyron assembles a document from your entries — a weekly summary, a compliance pack — and sends it to the people who need it, without anyone having to compile it. Lifecycles handle the follow-through, moving an entry through states such as open, in progress and closed as your team acts on it, so nothing that needs attention slips through.
Together these mean the routine — the reminders, the summaries, the chasing — happens on its own, and your team spends its time on the work that needs a person. To dig into each, see Automations, Reports and templates and Lifecycles.